Published research
Nutrient Solution Management System for Smart Farms and Plant Factory
2020 · 2020 International Conference on Information and Communication Technology Convergence (ICTC) · 1537–1542
Abstract
We present an automated system for nutrient solution management. Prior arts usually measure only pH and EC of the nutrient solutions for maintenance. When EC drops, they just simply add concentrated nutrient to the horticulture bed. Such approach can maintain the density of nutrient solution but cannot maintain the rates of individual ion particles. To prevent nutrition related disorders, fertilization methods with ion selective electrodes are widely introduced. This trend measures individual ion concentration of nutrient solution to maintain appropriate nutrient composition by supplying only insufficient ions. Many researchers have suggested ISE based automated fertilization systems. However, they failed to control a chemical artifact called ion interference effect, which becomes greater at higher density. Our system measures individual concentration of multiple ions and add only deficient nutrients, while handling the ion interference effect issue. To ensure the performance of ion selective electrodes, the system also performs fully automated 3-point calibration 24 times a day. A machine learning algorithm is applied on the sensory parts to remove ion interference effect which make measurement of complex solution with ISE almost impossible. With automated calibration and signal processing technology, the system robustly and continuously maintains nutrient condition for plants. We suggest applying this system on closed hydroponic systems such as smart farms or plant factory, to reduce water consumption and to provide more appropriate environment for the crops.
Keywords—Fertilization System, Horticulture, Machine Learning, Hydroponics, Smart Farm
I. INTRODUCTION
Closed-hydroponic system is a major trend of hydroponic culture field around the world. Unlike opened system which discards once-used nutrient solution, closed systems reuse nutrient solutions by forming a closed circuit of fertilizer. Most closed system has a tank for the nutrient solution and pumping system to deliver the fertilizer to plants. After it soak the roots of crops, it returns to the tank.
Most automated fertilization systems sold in the market measures pH and EC (electric conductivity) only. Their algorithm is so simple.
while (True):
    if (EC < threshold):
        add more nutrients;
    if (pH > threshold):
        add more acid;
This approach is simple and powerful. But, it do not consider that a plant is living organism and whose nutrition uptake tendencies are not uniform. For example, it does not distinguish the imbalance of nutrient ions and accumulation of useless components. The ion absorbance rates of plant are different because each rates are defined with both gene expression patterns and growth. [1] So it needs additional labors for maintenance. For example, a farmer should consider foliar spray to avoid nutrition disorder caused by deficient ions.
As smart farm becomes a major option in horticulture industry, hydroponic systems are widely propagated all around the world. Applying water culture on smart farm has many advantages. The biggest benefit is that it becomes easy to establish a multi-layered vertical farm, because aqueous fertilization enables nutrition supplication on multiple lanes with single pump. As demand for automated fertilization increased worldwide, critical weakness of EC and pH based management system has been studied well.
For example, operating closed system with EC and pH based fertilization system under Mediterranean climatic condition promotes NaCl accumulation in the nutrient solution, damaging the crops. [2] As EC measurement does not distinguish ions for nutrition from ions from irrigation water, it leads to inappropriate fertilization condition automatically.
Researchers now suggest measurement on individual ions with ion selective electrodes (ISE), not only to avoid salt accumulation issue but also to provide precise fertilization condition to the plants.
In 2010, Kim Won-Kyung et al. presented an ISE based nutrient measuring method. [3] They tried to investigate the nutrient solution to figure out whether NO3 ion is deficient or not. They suggested that measurement of nutrient ion with high accuracy would help precise fertilization and avoidance of water pollution.
However, they reported an unidentified error on K+ sensor; measured K+ concentration was 41% lower than theoretical value. It is ion interference effect, caused by interaction between ions and the glass membrane. The magnitude of this artifact was measured as 9~41%. [4] This artifact make ISEbased nutrient management system not feasible for farmers.
Kim Hak-Jin et al. suggested an ISE-based automated nutrient management system in 2013. [5] Their system provides automated sensor calibration and rinsing to maintain sensor accuracy. They tried to measure N, K and Ca ion individually with ISE, and supplied deficient ions only. It was a great stride on automated nutrient solution management technology. However, they also does not consider the ion interference effect. They reported a significant error on ISE values on high-density solution. For example, Ca2+ sensor had std error 20.8mg/L and the R2 of the calibration regression line was just 0.58.
Ruis-Ruiz et al designed a computer-operated platform for nutrient solution analysis and management in 2014. [6] They adopted both double-point and single-point calibration. Their method showed that single-point calibration is also useful for automated sensing because it can provide base potential shift △ E0. However, this approach was only applicable in single tank. Also they did not consider the ion interference effect, but did not report any measurement correctness information. Vardar’s method in 2015 [7] also has similar problems.
Woo-Jae Cho et al. presented an embedded system for automated fertilization system in 2017. [8] They also suggested an on-site ion monitoring system for precision hydroponic nutrient management in 2018. [9] Dae-Hyun Jung et al. suggested an automated control system for precision hydroponic macronutrient management in 2019. [10] Those 3 studies contributed for a concrete concept of automated nutrient solution management system with ISEs. They applied automated calibration for ISEs. Their methods figure out the deficient ion and add only insufficient ion only. We are sure that those ISE-based individual nutrient ion management system is inevitable will be a major and common concept of fertilization system for closed hydroponic systems. However, they did not consider the ion interference effect. They all reported increase of error between ISE values and theoretical values becomes greater in higher density solutions. Cho’s methods reported higher error rate on Ca2+ sensor, up to 25%. Jung’s method presented in 2019 reported RMSE of NO3 measurement as 57.59mg/L.
We suggested a machine-learning based algorithm for removal of ion interference effect in 2019. [11] This algorithm can readjust the ISE signals to restore its accuracy up to 98%. It also works in O(1) time after trained. We also designed a deep learning based algorithm for ISE signal processing in 2020. [12] It has 5 layers of artificial neural networks to regress correct signal to remove artifacts. It can remove both ion interference effect, artifact induced by the movement of solution and the interference of electrical signals between ISEs, within only one inference process. Its MAPE was less than 1.8% and R2 for regression was 0.997. P-value for artifact removal was 0.016.
We hope applying these latest methods on automated fertilization system will open up a feasible management system, which can be applied on the industry field.
II. SYSTEM ARCHITECTURES AND METHODS
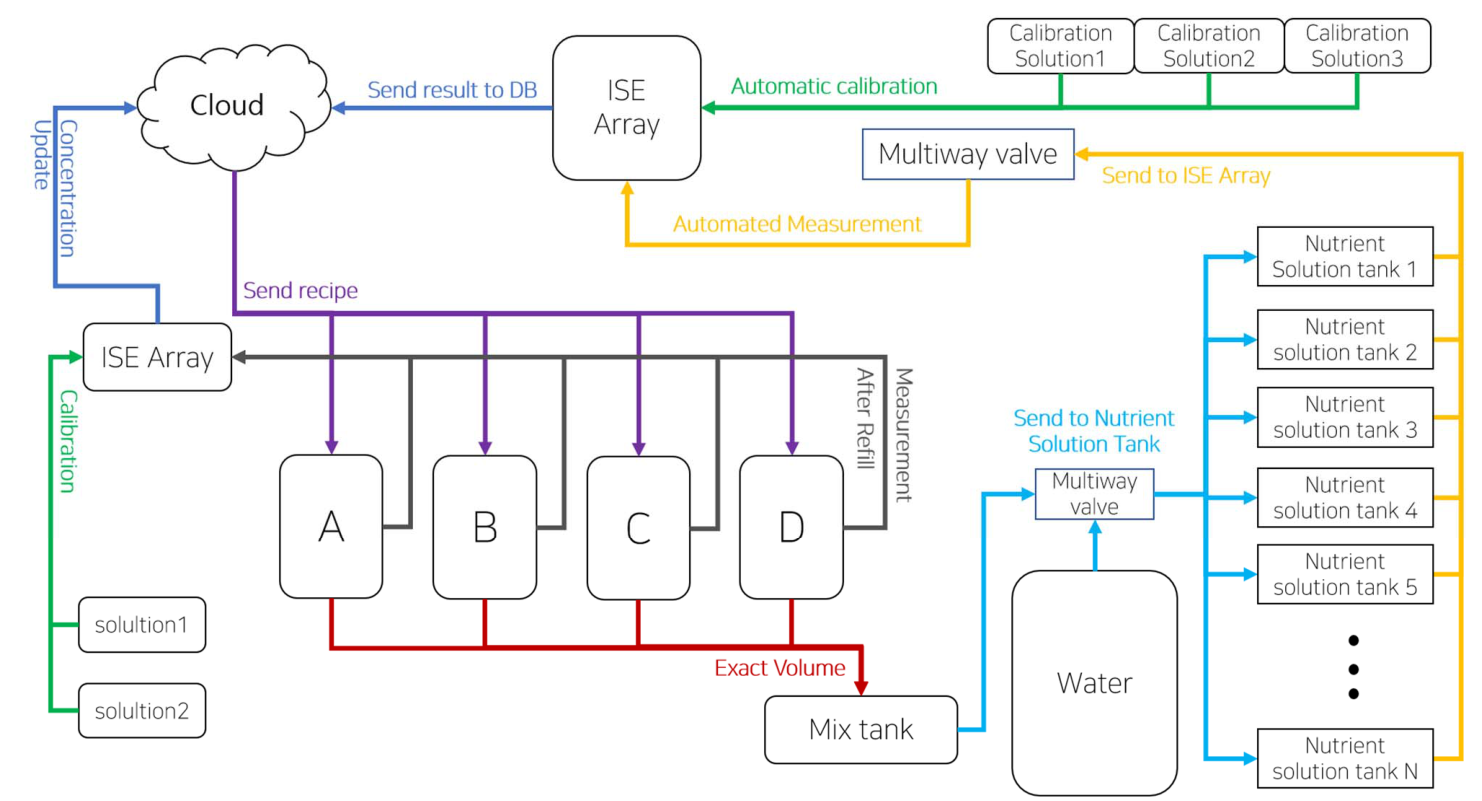
The system architecture is summarized on Figure 1. The management processing starts with yellow arrows at nutrient solution tanks. Small amount of nutrient solution is taken and sent to the ISE array. The sensors measure concentration of specific ions and send the voltage value to the cloud. The cloud server calculates a recipe for ion supply. Then the highconcentration tanks send exact volume of chemical concentrate to mix tank. After all, pump sends mixture of nutrient ions from mix tank to the nutrient solution tank. This is shortened process of a readjustment cycle.
A. Pumps and Multiway Valves
Every nutrient solution tank and the central water tank require pumps. The pumps are connected to the multiway valve. Multiway valve is a kind of pipe with multiple solenoid valves. An electrical signal can shift the water flow lines. For example, pumping after opening valves connected to tank A and sensor array while closing the others is enough to send water from tank A to the sensor array.
B. Sensor Array
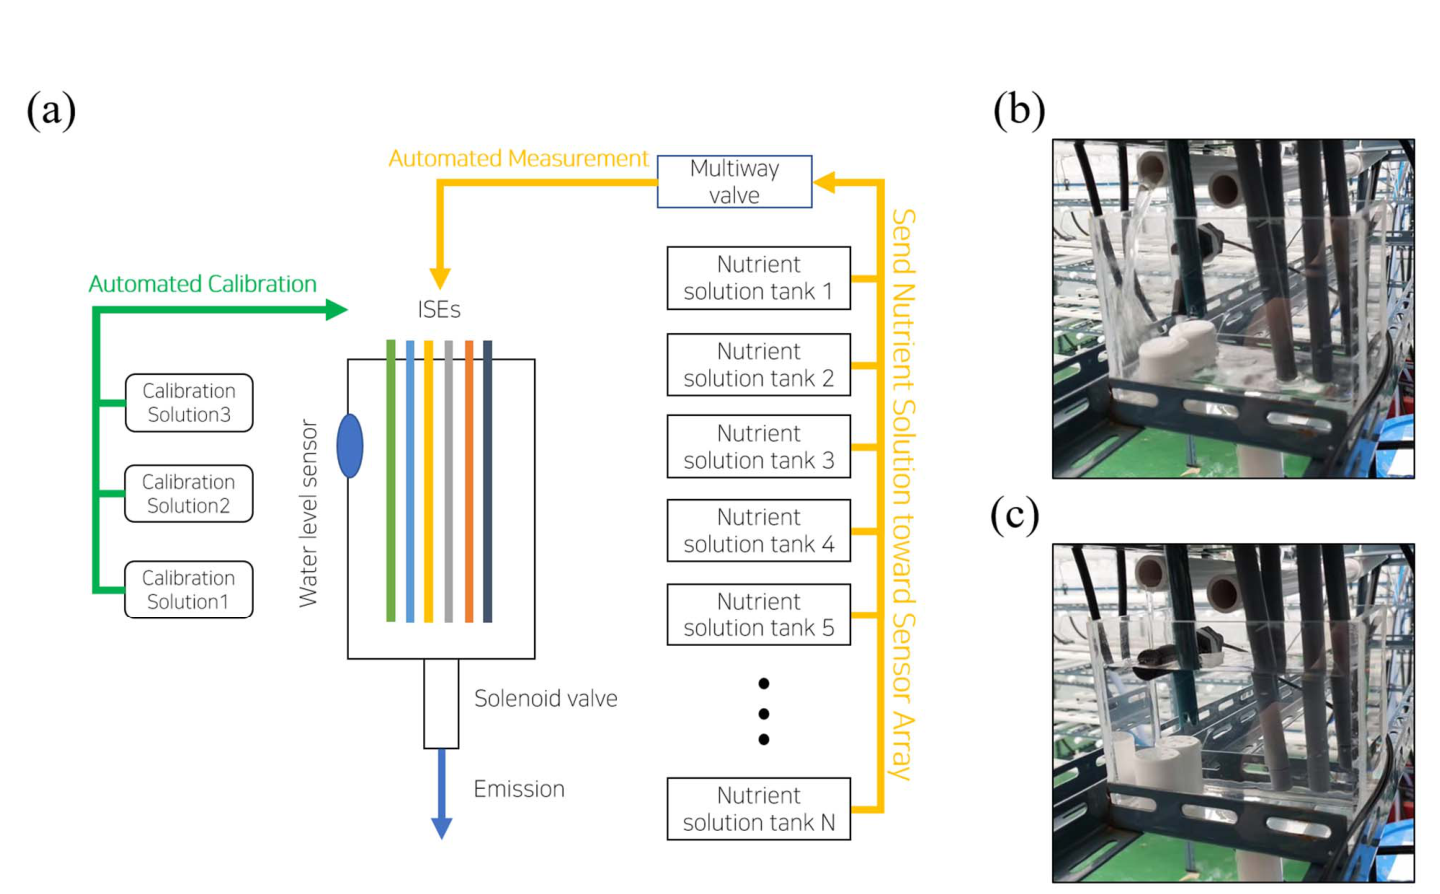
The structure of the sensor array is described on Figure 2 (a). EC, pH, K+ , Ca2+ , NH3+ and NO3- sensors are installed in a container. The container has a water level sensor on the wall and a solenoid valve below, to control the level of solution. Nutrient solution is taken from the tank to be analyzed. The system fills the container with sample solution until the level sensor responses. After a set of measurements, the solenoid valve opens to discard the solution.
The sensor array system has two different input line. First one is connected to the multiway valve, to receive nutrient solution samples from tanks. The other line is connected to calibration solutions. This line supplies 3 standard solutions to the sensor array. The composition of calibration solutions are provided on Table 1. The standard solutions are made with KNO3, Ca(NO3)2-4H2O and NH4H2PO4.
We applied multiple chemicals at same solvent for two reason. At first, we can directly apply machine learning algorithms for removal of ion interference effect [11, 12] on the mixture of solutes. Secondly, calibration on the mixture of solutes can reduce the magnitude of artifacts because the ion interference effect is not a random value. It has correlation with concentration and composition of solution, which can be described with Nikolsky-Eisenman equation [13]. Calibration on multi-ion solution can regress this nonlinear but correlated artifact at the same time.
| Solution 1 | Solution 2 | Solution 3 | |
|---|---|---|---|
| K+ | 4 | 3.2 | 2.4 |
| Ca2+ | 1 | 0.8 | 0.6 |
| NO3- | 6 | 4.8 | 3.6 |
| NH4+ | 0.5 | 0.4 | 0.3 |
Measured values are not processed on the sensor array system. The values are sent to the cloud server.
C. Cloud Server
Most farming IoT systems common in the market require separated control rooms to store server computers. They consumes ground area where a plant growth machine could be installed. And they make the farmers to pay the room facility cost, server computer cost and the operational cost. Such onpremise approaches are still a state-of-art technology in smart farm industries, while other industries urge to migrate toward cloud system: cloud or dare. We applied cloud server rather than physical server computers to reduce the installation and maintenance cost for users. We constructed cloud SAAS system for nutrient solution management on Microsoft Azure.
The sensor and actuators of the nutrient management system continuously report their own information. Sensors send the measured data and the actuators send their on-off status. Then the cloud server gathers data to make decisions on system control.
D. Calibration Strategy
The data sent from the sensor array is analyzed. Measurements on standard solutions provide information for calibration of sensors. As each measurement send 3 different values on 3 different solutions, the system can performs 3 point calibration for every measurement period.
We also suggest applying 3 different 2 point calibrations and calculating the average value of 3 lines, rather than single regression for 3 point calibration. This approach reduces the time complexity. It runs so quick on small computers too. This approach may reduce the correctness, but also reduces the computational cost very dramatically. Even an educational embedded computer such as Arduino can run it within a second. We hope the manufacturers consider this to reduce the cost to widely spread nutrient management solutions to undeveloped countries or to those who do not afford traditional smart farming solutions.
Algorithms for ion interference effect or other artifact removal is applied on this step.
E. Concnetrate Solutions
The system has 4 concentrate tanks, which are labeled as A, B, C and D on Figure 1. When a nutrient solution tank requires additional nutrient ion, the system send concentrated nutrients from the concentrate tanks. The compositions of concentrate tanks are described on Table 2.
| Name | Compounds | Type 1 | Type 2 |
|---|---|---|---|
| A | KNO3 | 202.4 | 202.4 |
| B | NH4H2PO4 | 28.75 | 86.25 |
| KNO3 | 0.4 | 0.4 | |
| C | Ca(NO3)2-4H2O | 118 | 472 |
| EDTA-Fe | 15 | 15 | |
| KNO3 | 0.4 | 0.4 | |
| D | MgSO4-7H2O | 61.5 | 123 |
| H3BO3 | 1.43 | 1.5 | |
| MnSO4-4H2O | 1.07 | 1 | |
| ZnSO4-7H2O | 0.11 | 0.25 | |
| CuSO4-5H2O | 0.04 | 0.05 | |
| Na2MoO4-4H2O | 0.01 | 0.01 | |
| KNO3 | 0.4 | 0.4 |
Type 1 is designed for leafy crops such as lettuce. Type 2 is designed for Brassica genus crops such as kale.
Type 1 solution set is 500 times concentration of Yamazaki’s lettuce solution recipe. [14] Type 2 solution set is 500 times concentration of Minwoo Lee’s Brassica solution recipe [15], which is designed from Kale’s nutrient solution proposed by Korea National Institute of Horticultur and Herbal Science in 2003 [16]. The government’s recipe does not have guidance for microelements such as Zn or Cu. Lee designed microelement content and replaced chemical compounds into those which are commonly used in agricultural industry to produce Yamazaki’s lettuce solution.
F. Concnetrate Tanks
Each concentrate tanks has volume measurement system, which has a pump, container, water level sensor and a solenoid valve. The architecture of volume measurement system is described on Figure 3.
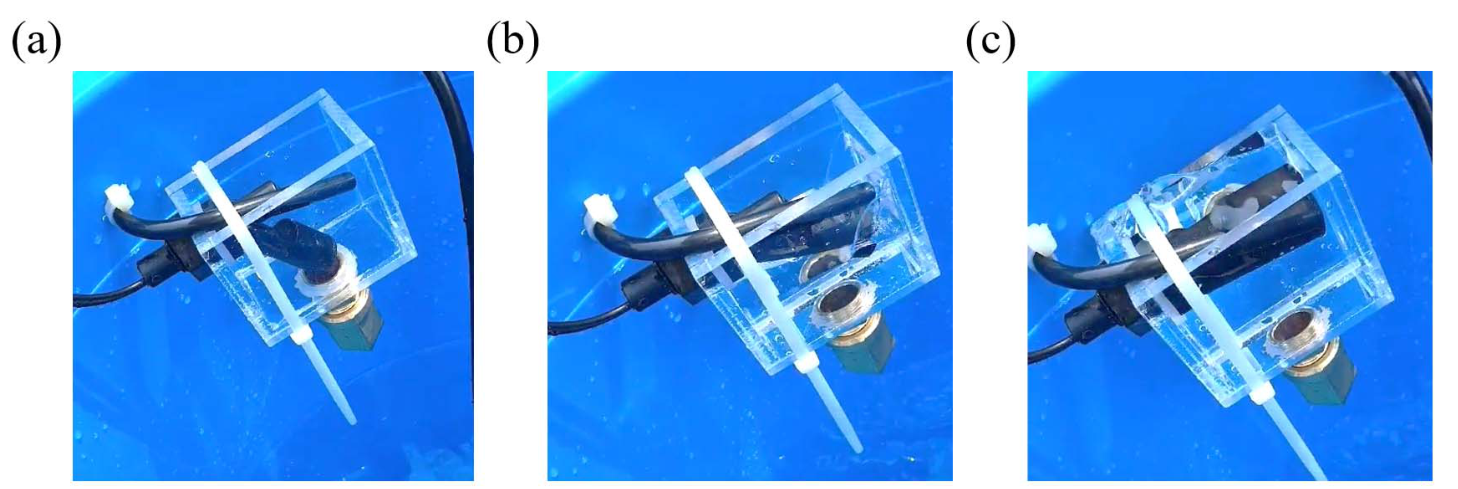
The solenoid valve is NO type. It is usually opened, but get closed when electricity is supplied. This valve is connected on the same power source of pump. When the source is on operation, valve gets closed and pump transport the concentrate solution into the container. When the water level sensor reports that the container is full, then the power source stops supplying electricity. Pump stops and valve opens. For each step, 102mL of concentrate solution is taken from the tank. The solution is then transported to mix tank.
G. Mix Tank
Mix tank receives nutrient concentrate from concentrate tanks. 4 different solutions mix together here. Mix tank has a pump connected to multiway valve. Nutrient solution for readjustment is sent to the target nutrient solution tank.
H. Readjustment Strategy
Nutrient solution tanks have water level sensors at 100L point. Before measuring the nutrient concentration, the system supply water to the tank so the water content becomes 100L. The measurement requires 1 Liter sample. Therefore, 99 L solution remains after a measurement. Calculation of the ion supply is described as equation 1. Ct is a vector for ion concentrations of nutrient solution tanks and Cc is a vector for nutrient concentrate tanks.
The result of equation 1 describes the volume of nutrient concentrate required for readjustment. Dividing this wit 102mL is enough to decide how many cups to add.
I. Measurement of Concentrate Solution
When the level of concentrate solution drops, it should be refilled. But farmers (users) may failed to maintain the concentration during refill. So we applied additional sensor array to measure the concentration of high-concentrate solutions. We consider a powder typed product. A user can fill the tank with water, and simply put everything in a package into the tank. The ratio of nutrient ion should be controlled with this product type.
We applied only K+ and NO3- sensor to reduce the cost. All concentrate solutions on Table 2 has KNO3. Solution A is measured with NO3- sensor and the others are measured with K+ sensor, for two reason. First, K+ sensor is enough to measure the components of solution B, C, D. Second, the concentrations of K+ and NO3- are too high in solution A. A sensor calibrated with low density does not work appropriately on high density solution. So we applied NO3- sensor only on solution A, separated from other solutions. We tried to minimize the number of ISEs because they are too expensive to be applied on farming area.
Sensor array for concentrate solution measurement are also calibrated automatically. The Calibration-measurement routine needs to be launched only a concentrate tank is refilled.
III. OPERATION TEST
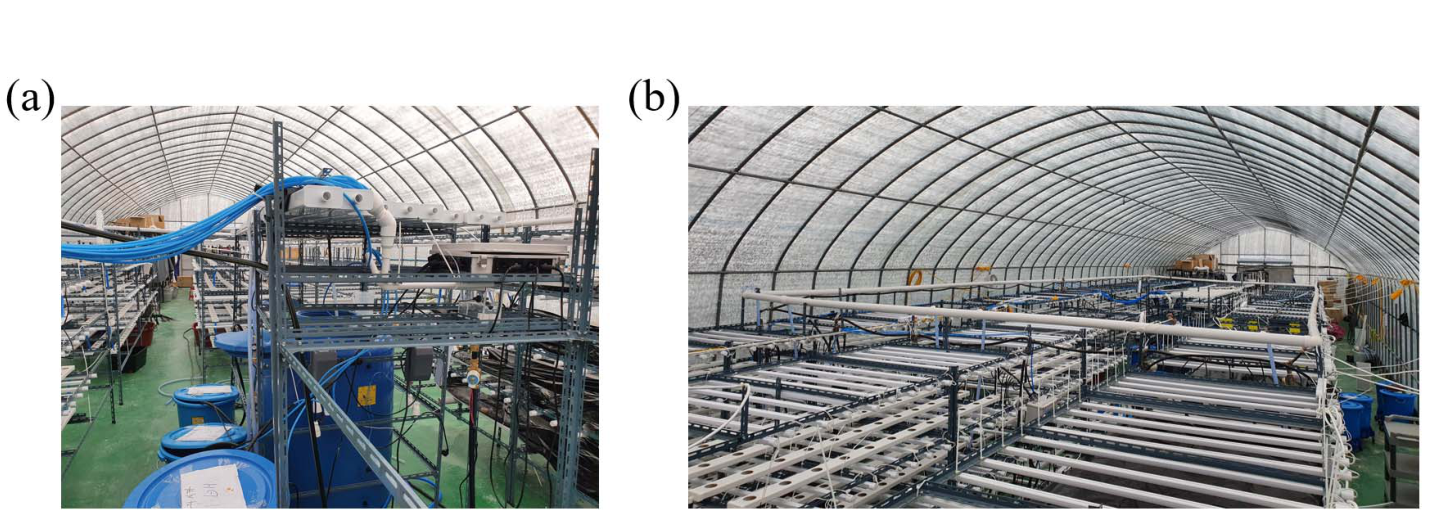
We operated a 180 m2 scaled vertical smart farm with this system for test. The farm used nutrient film technique (NFT) as cultivation method, and has 4 layers of fields. The system is described on Figure 4 (a) and the smart farm facility is described on Figure 4 (b).
The system successfully measured the nutrient concentration of each tank, and calculated the readjustment scenario, and readjusted the nutrient solution in the tank. Physically, it worked well. We operated the system for 2 weeks without crop planted to check the performance of hardware.
IV. DISCUSSION
The system successfully showed the possibility of fully automated fertilization system. As its mechanical and algorithm design worked appropriately, we need further experiment on horticultural application. We will test the device with more than 8,000 plants. We now consider testing with lettuce because its life cycle is very short; 4 weeks are enough to check from the seed to the adult. We think that applying type 1 solution for lettuce test.
V. CONCLUSION
An architecture and operation algorithm for fully automated fertilization system is proposed. This method is designed for closed hydroponic facilities. The system measures the concentrations of individual ions rather than measuring EC and pH only. The purpose of this system is supplying insufficient ions only, with precise measurement. It has fully automated calibration function for ISEs and has 4 different nutrient concentrate for readjustment. The system is fully compatible with ISE artifact control algorithms. This system uses Azure based cloud system to avoid the great cost of on-premise systems, which are common on the market today. The mechanical component and algorithm worked appropriately for 4 weeks, measuring and maintaining chemical components of nutrient solution tanks without plant. A further experiment with living plant would provide the evidence of feasibility and utility of this method.
ACKNOWLEDGMENT
This work was supported by Agriculture, Food and Rural Affairs Convergence Technologies Program for Educating Creative Global Leader funded by the Ministry of Agriculture, Food and Rural Affairs (MAFRA, Korea). [Project Number 1545020852].
REFERENCES
-
[1] Ban, B. Mathematical Model and Simulation for Nutrient-Plant Interaction Analysis. Preprints 2019, 2019090219. (doi: 10.20944/preprints201909.0219.v2)
-
[2] Neocleous, Damianos, and Dimitrios Savvas. "NaCl accumulation and macronutrient uptake by a melon crop in a closed hydroponic system in relation to water uptake." Agricultural Water Management 165 (2016): 22-32.
-
[3] Kim, Won-Kyung, et al. "Sensing NO 3-N and K Ions in Hydroponic Solution Using Ion-Selective Membranes." Journal of Biosystems Engineering 35.5 (2010): 343-349.
-
[4] Ban, Byunghyun, Donghun Ryu, and Minwoo Lee. "Machine Learning Approach to Remove Ion Interference Effect in Agricultural Nutrient Solutions." 2019 International Conference on Information and Communication Technology Convergence (ICTC) . IEEE, 2019.
-
[5] Kim, Hak-Jin, et al. "Automated sensing of hydroponic macronutrients using a computer-controlled system with an array of ion-selective electrodes." Computers and electronics in agriculture 93 (2013): 4654.
-
[6] Rius-Ruiz, F. Xavier, et al. "Computer-operated analytical platform for the determination of nutrients in hydroponic systems." Food chemistry 147 (2014): 92-97.
-
[7] Vardar, Gökay, et al. "Measuring calcium, potassium, and nitrate in plant nutrient solutions using ion-selective electrodes in hydroponic greenhouse of some vegetables." Biotechnology and applied biochemistry 62.5 (2015): 663-668.
-
[8] Cho, Woo Jae, et al. "An embedded system for automated hydroponic nutrient solution management." Transactions of the ASABE 60.4 (2017): 1083-1096.
-
[9] Cho, Woo-Jae, et al. "On-site ion monitoring system for precision hydroponic nutrient management." Computers and electronics in agriculture 146 (2018): 51-58.
-
[10] Jung, Dae-Hyun, et al. "Validation testing of an ion-specific sensing and control system for precision hydroponic macronutrient management." Computers and electronics in agriculture 156 (2019): 660-668.
-
[11] Ban, Byunghyun, Donghun Ryu, and Minwoo Lee. "Machine Learning Approach to Remove Ion Interference Effect in Agricultural Nutrient Solutions." 2019 International Conference on Information and Communication Technology Convergence (ICTC) . IEEE, 2019.
-
[12] Ban, B.; Ryu, D.; Lee, M. Deep Learning Method to Remove Chemical, Kinetic and Electric Artifacts on ISEs. Preprints 2020, 2020050381 (doi: 10.20944/preprints202005.0381.v2).
-
[13] Hall, Denver G. "Ion-selective membrane electrodes: a general limiting treatment of interference effects." The Journal of Physical Chemistry 100.17 (1996): 7230-7236.
-
[14] Yamazaki K. Nutrient solution culture. Tokyo, Japan: Pak-kyo Co; 1982. Japanese
-
[15] Minwoo Lee. “Brassica Nutrient Solution(Basic).” Researchgate (2018) https://www.researchgate.net/publication/342122756
-
[16] Korea National Institute of Horticultur and Herbal Science. “ 농업기술길잡이 수경재배 ( 양액재배 )” (2013) .
Citation
형식을 누르면 인용 정보가 복사됩니다.