Preprint · not peer-reviewed
An ODE-Network-Based Chemical Complex System Simulator for Multi-Environment Fermentation
2026
Abstract
Fermentation is a slow chemical-biological process in which substrates, enzymes, yeast biomass, oxygen, pH, temperature, and metabolic products co-evolve. This paper presents an ODE-network-based chemical complex system simulator for multi-environment fermentation. A shared state-space was instantiated for bread dough, rice wine, beer wort, and malt mash/wort, and a one-command Python workflow generated 108 simulated conditions with CSV outputs. The sweep produced interpretable optima and failure modes that aligned semi-quantitatively with literature-reported fermentation ranges, supporting the model as a compact benchmark for fermentation design and future control studies.
Keywords— fermentation simulation; ODE network; chemical complex system; yeast; saccharification; beer; rice wine; bread dough; malt wort
Introduction
Fermentation processes are often described as recipes, but their internal dynamics are slow, partially observed chemical-biological systems. Substrates are released or consumed, yeast biomass grows and decays, oxygen availability changes, pH drifts under acid formation and buffering, ethanol accumulates as both product and inhibitor, and carbon dioxide either escapes or remains trapped depending on the physical environment.
This work treats fermentation as a chemical complex system. Each meaningful chemical, biological, or environmental quantity is represented as a node, and each uptake, enzymatic conversion, inhibition, stress response, or product formation term is represented as a differential interaction. The goal is not to replace process-specific industrial digital twins, but to provide a reusable ODE-network scaffold that can be adapted across multiple fermentation environments while preserving interpretable state variables and failure modes.
The motivation follows previous work on nonlinear agricultural nutrient-solution systems. ODE-network modeling represented nutrient solutions as interacting chemical components rather than a single electrical-conductivity value [2], while nutrient-plant interaction analysis added a coupled organism-environment layer [3]. Nutrient-solution management and ion-sensor artifact removal studies further showed that chemically crowded media need explicit component modeling and data-processing layers [4]-[6]. The present paper transfers this modeling philosophy from nutrient environments to fermentation environments.
The phenotype control kernel study treated biomolecular regulation as a network whose system-level behavior can be interpreted through compact control structures [1]. Although the present work uses fermentation chemistry rather than regulatory logic, the same systems view motivates node-level representation and interaction-level interpretation.
In the agricultural nutrient-solution model, chemical states were updated through coupled differential equations [2]. The nutrient-plant interaction model then placed a biological component in contact with a chemical environment [3]. Yeast fermentation follows the same bidirectional logic: the environment supplies carbohydrate, nitrogen, oxygen, temperature, and pH conditions; yeast metabolism returns ethanol, CO2, acid, glycerol, acetate, biomass, and stress. This gives a direct conceptual bridge from plant-factory chemical complex systems to fermentation systems.
The practical sensor-oriented studies [5], [6] are also relevant because fermentation media, like agricultural nutrient solutions, are chemically crowded and nonlinear. Aggregate readings such as Brix, pH, or final ethanol cannot explain whether a process was saccharification-limited, nitrogen-limited, acid-stressed, oxygen-limited, or ethanol-inhibited. The simulator therefore exports full time-series CSV files, condition-level summaries, and reconstructed network edge lists.
Methodology
ODE Network Simulator Design
The simulator represents each condition as a state vector containing carbohydrate pools, environmental resources, yeast physiology, and metabolic products. Carbohydrate states include starch, dextrin, maltose, maltotriose, glucose, and fructose. Resource and environmental states include assimilable nitrogen, dissolved oxygen, pH, temperature, enzyme activities, and gas retention. Biological and product states include yeast biomass, ethanol, total CO2, retained CO2, glycerol, acetate, acid, stress, and activity.
The ODE network is not stored as a separate graph object in the code. Instead, it is encoded implicitly by the state vector and the right-hand-side flux equations. In implementation terms, STATE_NAMES defines the dynamic nodes, rhs() defines the fluxes and regulatory interactions, and euler_step() performs the synchronous update x(t + Delta t) = max(0, x(t) + Delta t f(x(t), theta, c)). For reporting and visualization, a directed structural graph was reconstructed from these state variables, regulatory factors, and flux terms.
Enzymatic carbohydrate release is represented by a simplified chain from starch to dextrin, dextrin to maltose, and maltose to glucose, modulated by temperature and pH activity factors. Rice wine uses this module throughout fermentation to approximate simultaneous saccharification and fermentation. Malt mash/wort uses it during a pre-saccharification phase before yeast inoculation. Bread dough uses a weaker flour-derived release process, whereas beer wort starts from a saccharified wort-like state with maltose, maltotriose, glucose, and residual dextrin.
Yeast uptake is modeled by saturation and preference terms over the available fermentable carbohydrates. Growth and product formation are modulated by nitrogen availability, oxygen availability, ethanol inhibition, acid stress, pH mismatch, temperature mismatch, and substrate inhibition. Fermentative flux generates ethanol and CO2, while side-product fluxes generate glycerol, acetate, and acid proxies. The equations are deliberately lightweight so that the model remains inspectable, portable, and suitable for automated parameter sweeps.
Environment Implementations
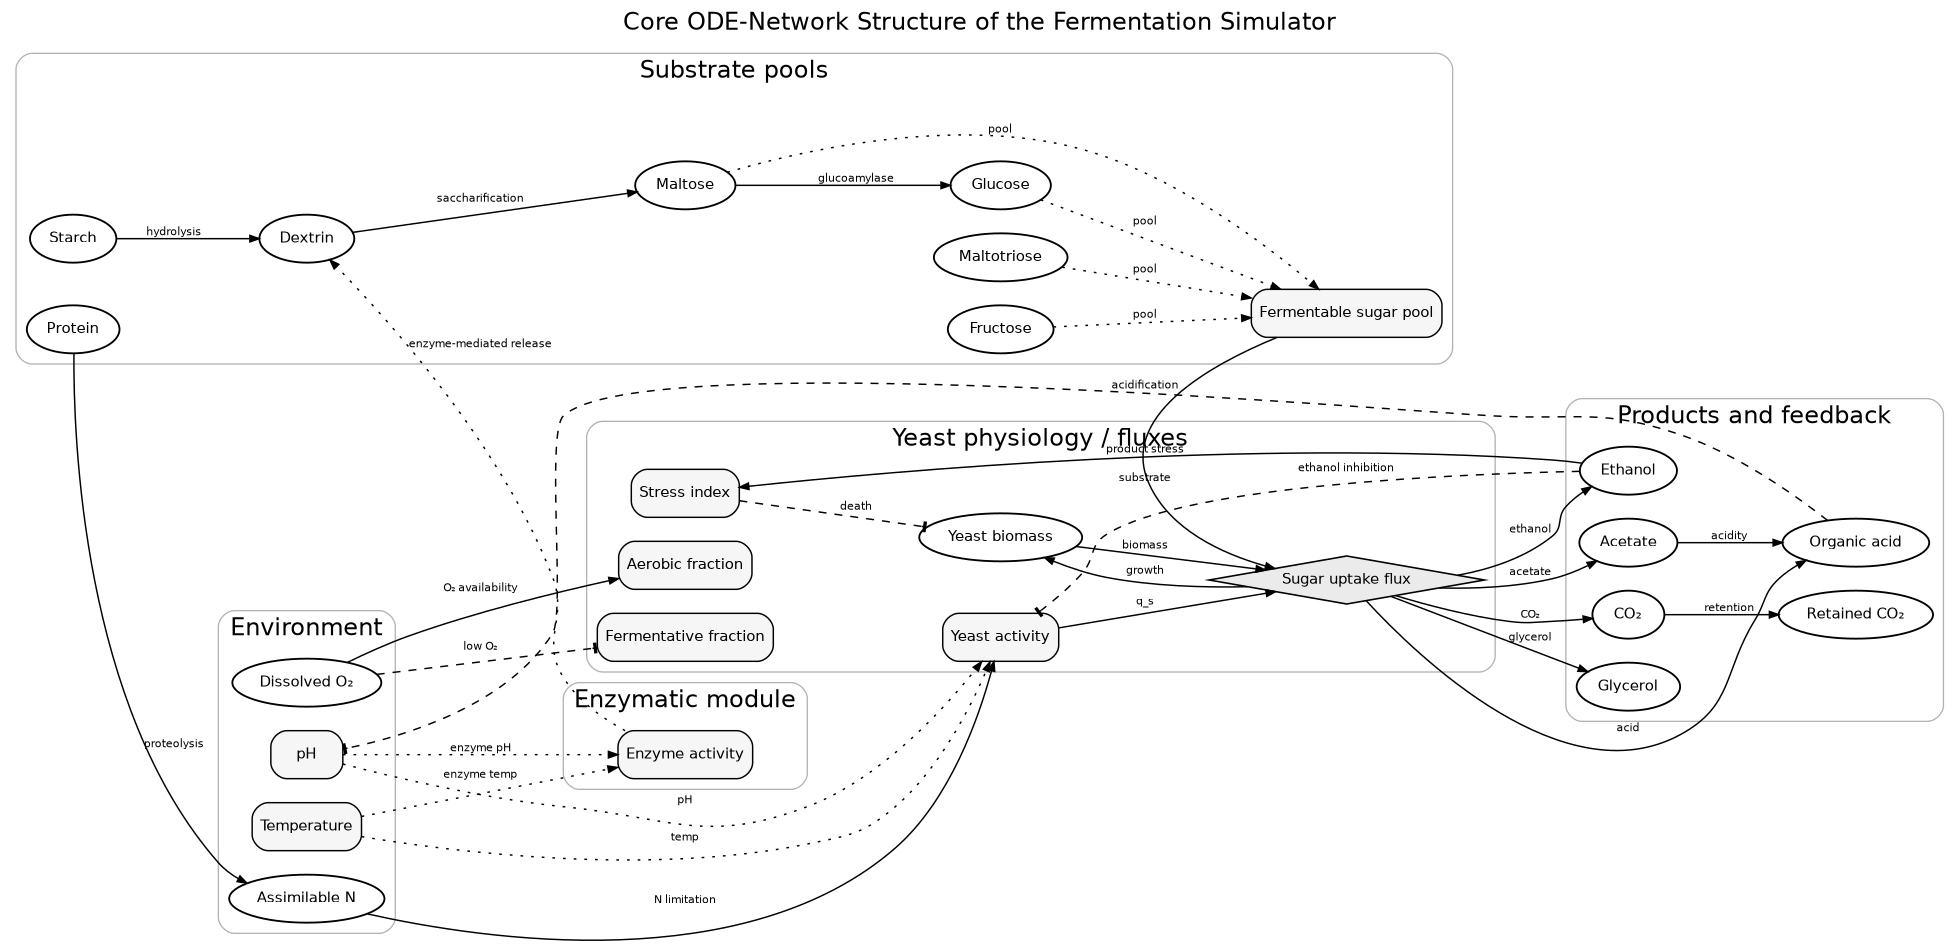
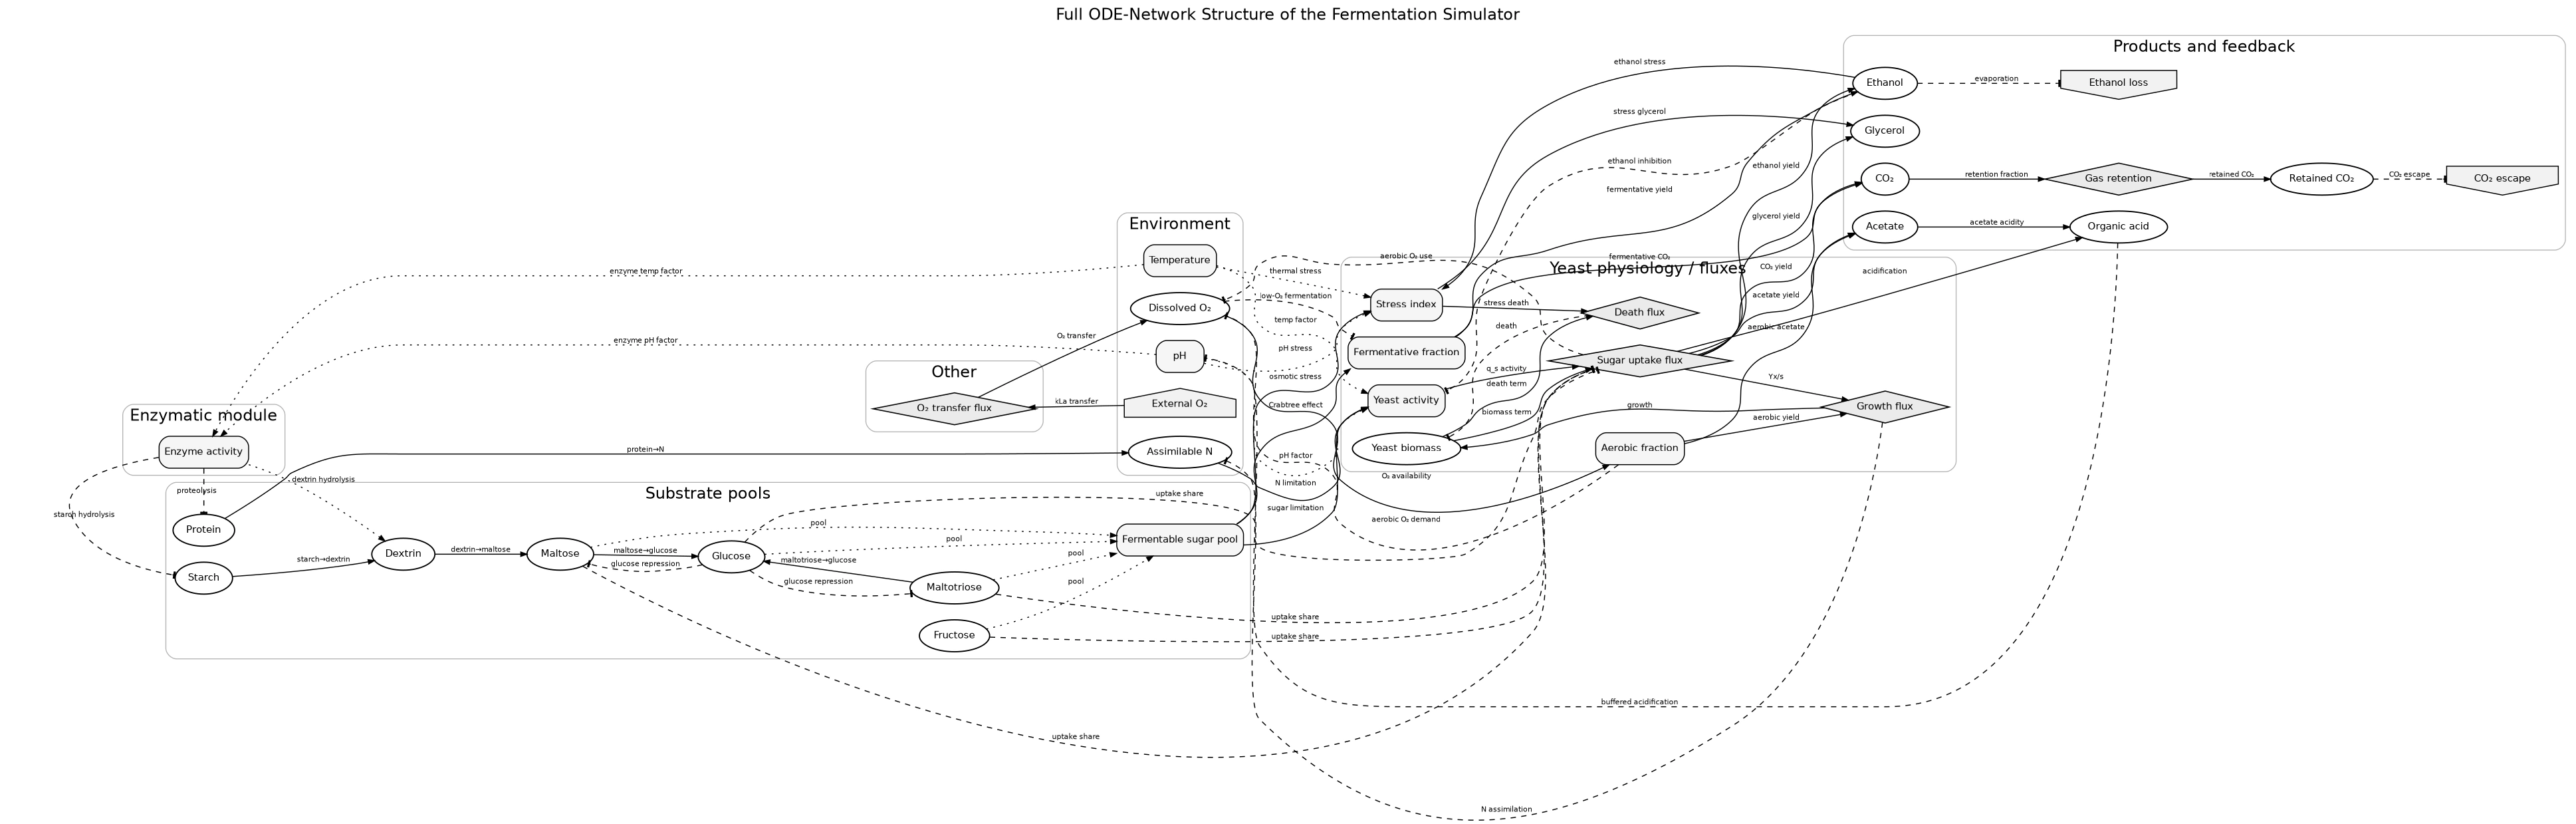
Four fermentation environments were instantiated from the shared model skeleton. Bread dough emphasizes short-window CO2 productivity and retained CO2, with ethanol treated as a secondary byproduct. Rice wine emphasizes starch-rich simultaneous saccharification and fermentation, in which saccharification strength and temperature strongly affect final ethanol and residual carbohydrate. Beer wort emphasizes maltose/maltotriose consumption, apparent attenuation, ethanol, pH, glycerol, acetate, and stuck-fermentation flags. Malt mash/wort uses a staged protocol in which a hot enzymatic mash phase is followed by cooled yeast fermentation.
Table 1. Best-ranked simulated conditions and literature-alignment anchors.
| Env. | Best simulated condition | Output | Interpretation |
|---|---|---|---|
| Bread | baker-like, standard sugar, 30 C | retained CO2 at 4 h = 2.69 g/L | directionally aligned with 30 C CO2-production assays; conversion to mL CO2/10 g flour remains a calibration layer |
| Rice wine | stress-tolerant, strong-koji, 25 C | 87.82 g/L ethanol; 11.13% v/v | matches reported makgeolli-like 25 C fermentation near 11% alcohol |
| Beer wort | ale-like, standard wort, low O2, 22 C | 49.18 g/L ethanol; 6.23% v/v | ethanol aligns with ale-like fermentation; pH acidification remains under-calibrated |
| Malt wort | 62 C mash, heavy grist, 25 C fermentation | 38.05 g/L ethanol; 4.82% v/v | consistent with maltose-rest region and ordinary beer alcohol range |
ABV is approximated as ethanol_g_L / 7.89 for coarse cross-study comparison.
The different environments do not require different simulator code paths for basic yeast metabolism. Instead, each environment changes initial states, schedule parameters, enzyme activity, oxygen transfer, temperature, pH, substrate composition, retention, and objective function. This provides a practical test for the chemical-complex-system claim: the same ODE-network skeleton should generate distinct but interpretable dynamics when placed in different environmental regimes.
A total of 108 conditions were generated. Bread conditions swept strain type, sugar condition, and temperature. Rice-wine conditions swept strain type, saccharification strength, and temperature. Beer conditions swept yeast type, wort gravity, oxygen regime, and temperature. Malt mash/wort conditions swept mash temperature, grist level, yeast physiology, and fermentation temperature.
Automated Experimental Workflow
The public repository contains a one-command Python workflow that generates the experimental design, runs the condition sweep, and exports CSV-only results. The default run writes experiment_conditions.csv, timeseries.csv, summary.csv, environment_rankings.csv, column_dictionary.csv, and manifest.csv. This design intentionally separates simulation from later analysis: users can run the model once, upload the CSV outputs, and analyze trajectories, rankings, or failure modes without rerunning the simulator.
The primary outputs are time-series trajectories and condition-level summaries. Derived metrics include final ethanol, approximate ABV, final carbohydrate pools, retained CO2, pH, apparent attenuation, total-carbohydrate conversion, objective scores, and failure-mode labels. For rice wine and malt mash/wort, attenuation is interpreted carefully because fermentable sugars are released during the run; total-carbohydrate conversion is therefore a more appropriate measure than initial-sugar attenuation.
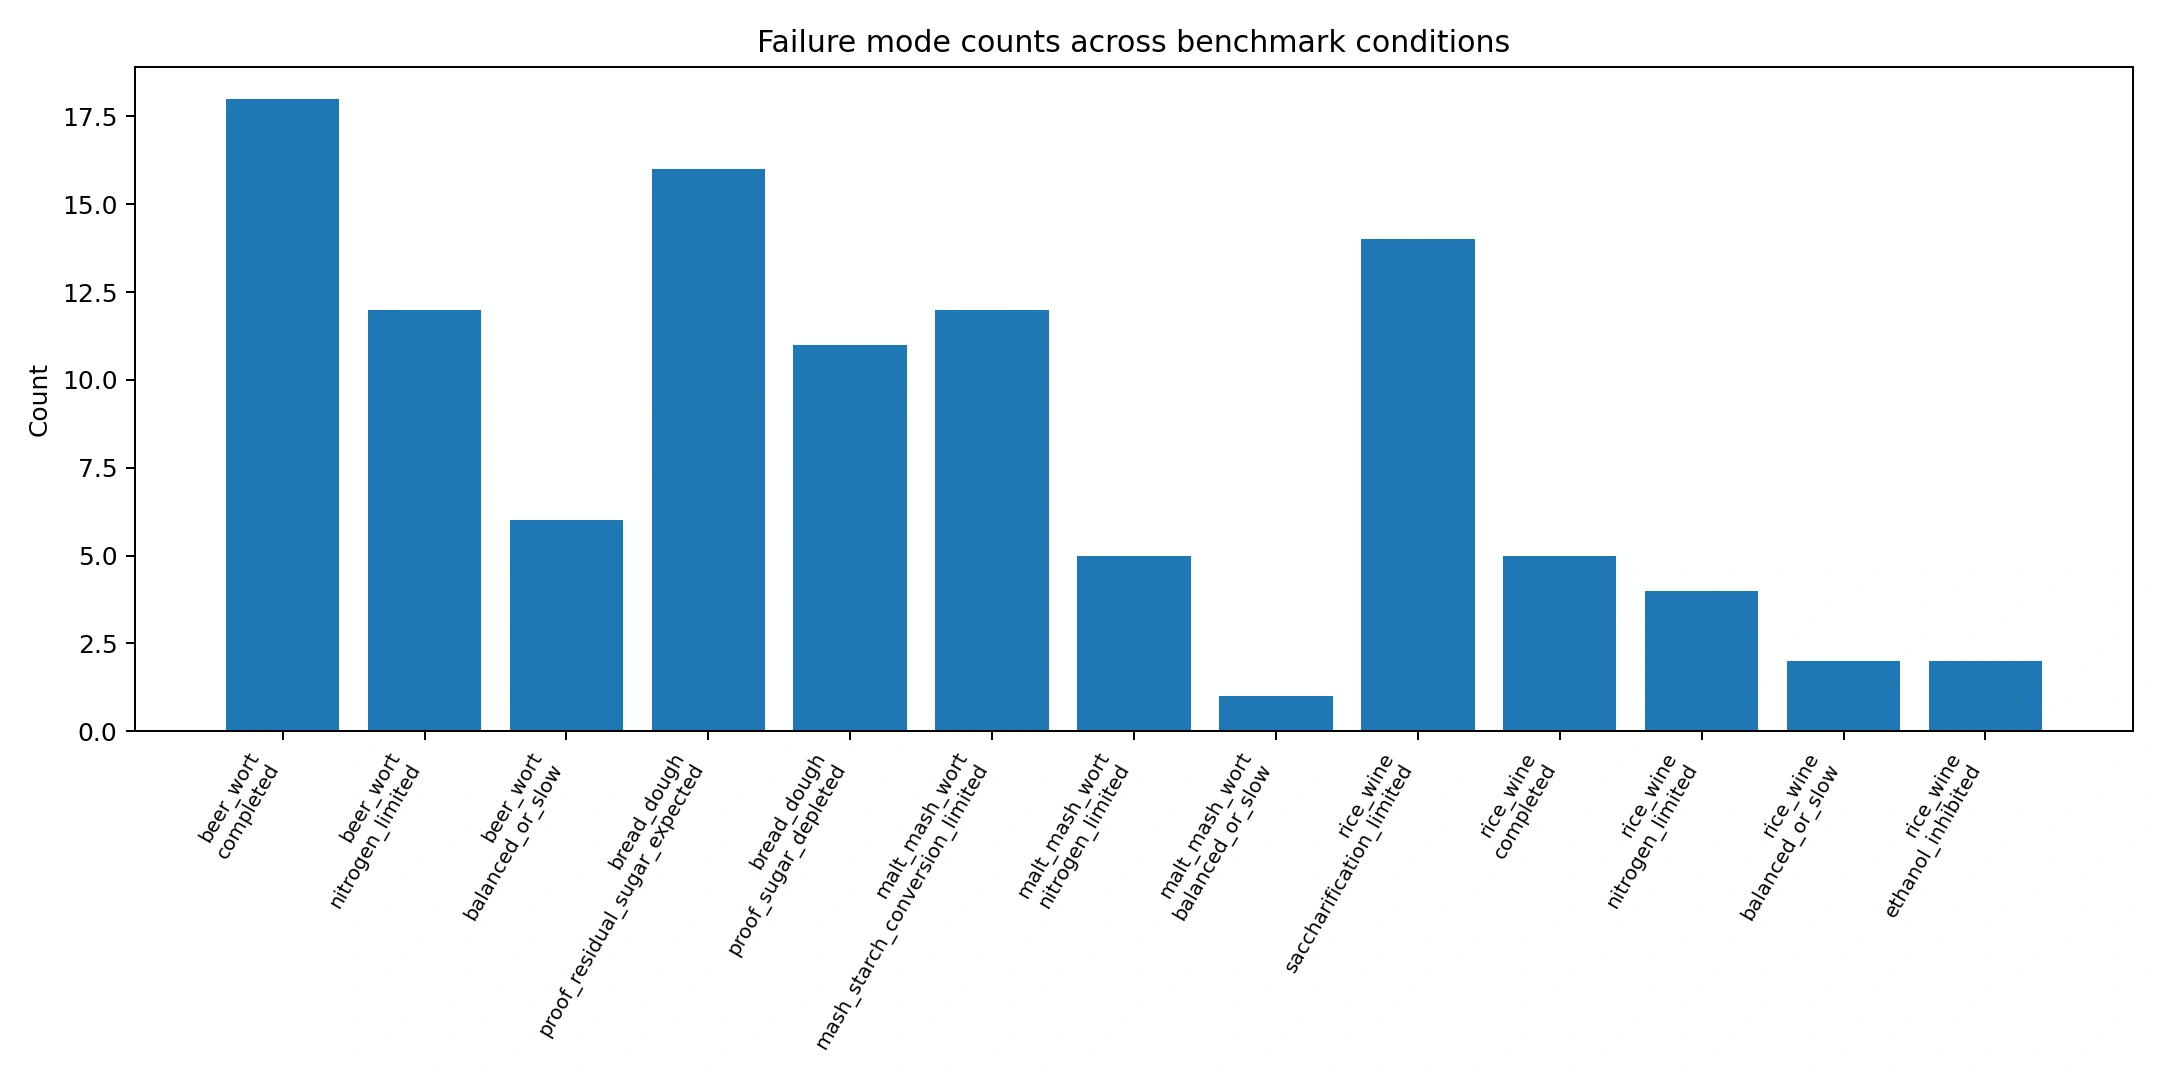
Failure modes are rule-based labels intended to summarize the dominant bottleneck. Examples include completed, nitrogen_limited, mash_starch_conversion_limited, acidic_stress, and balanced_or_slow. These labels are not presented as diagnostic ground truth; they are designed to make the simulator useful as an interpretable benchmark and to indicate which model component should be calibrated or controlled in later experiments.
Code-to-graph mapping
The visual ODE network was generated from an explicit code-to-graph mapping rather than from a separate graph object. The state vector defines the dynamic nodes, while the right-hand-side function defines reaction, uptake, regulatory, and product-formation terms. This mirrors the original chemical complex system style: the simulation is numerical, but the interpretation remains graph-based because every update term corresponds to a directed interaction between state variables or between a regulatory factor and a flux.
For reporting, the reconstructed network was divided into a core graph and a full graph. The core graph keeps only the major state variables and dominant flux families, making it suitable for the main conceptual figure. The full graph expands the same structure into implementation-level terms, including enzyme activity factors, pH and temperature gates, nitrogen and oxygen availability, ethanol inhibition, acid stress, substrate inhibition, gas escape, and retained CO2. The full graph is therefore closer to a code map than to a simplified conceptual diagram.
The edge categories used in the visualization are enzymatic conversion, yeast uptake, biomass growth, product formation, inhibition or stress, environmental regulation, and physical transfer. This classification is useful for later model extension because a new process can be added by adding states and edge groups, rather than by rewriting the entire simulator. For example, bread-specific gas retention can be improved by adding physical dough-retention edges, while beer pH calibration can be improved by modifying acid-production and buffer-response edges.
This code-to-graph mapping also clarifies the status of the present model. The simulator is not claiming that every edge has been independently fitted to experimental kinetic constants. Instead, the network is a transparent, semi-quantitative scaffold whose modules can be calibrated as data become available. The node and edge CSV files listed in the supplementary materials are included so that readers can inspect the structural assumptions behind Figures 1 and 2.
Results
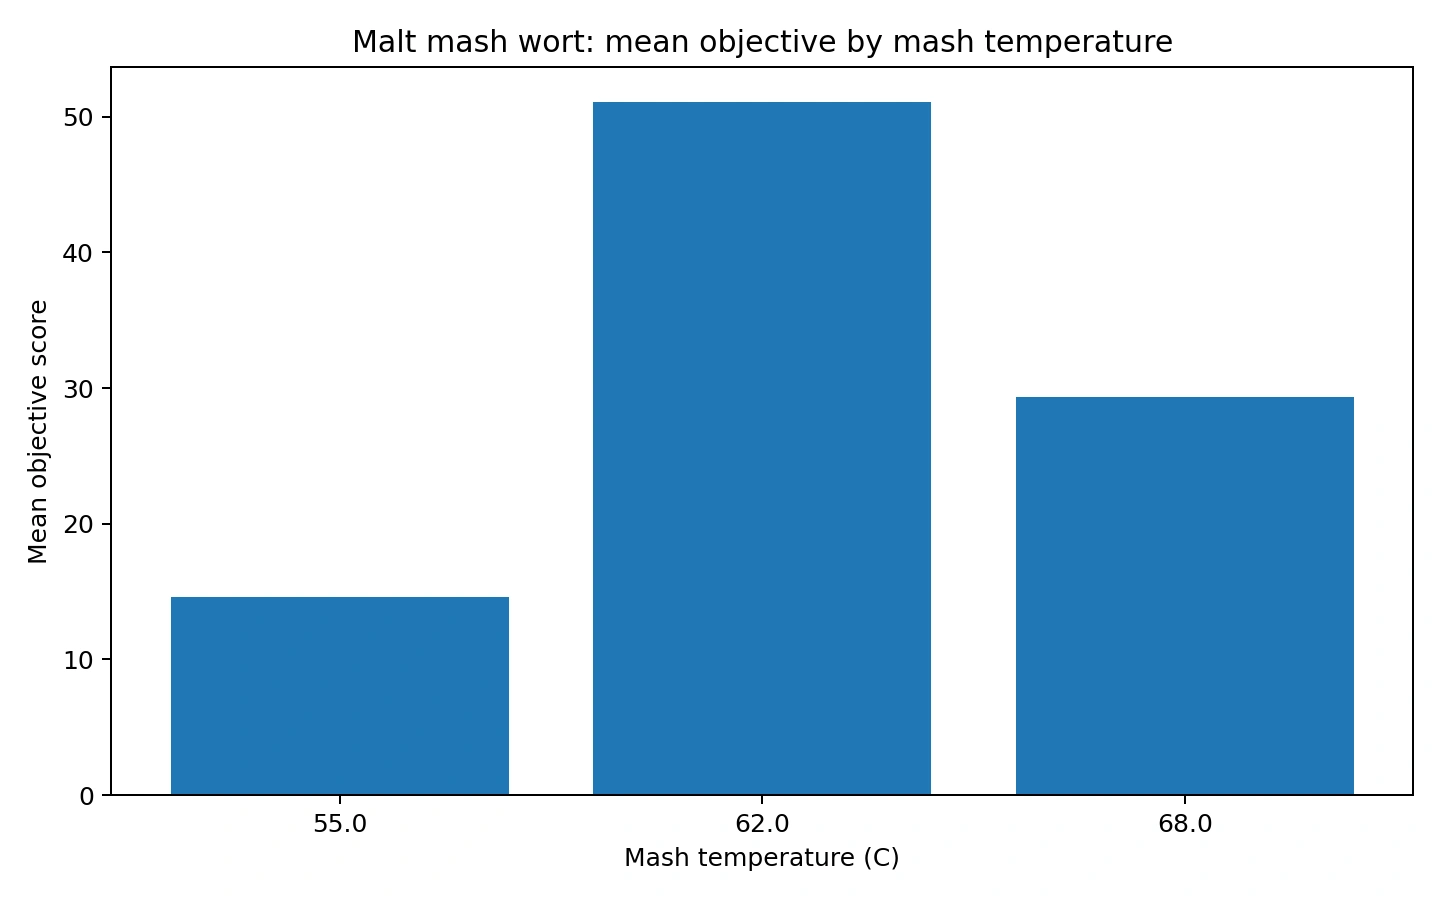
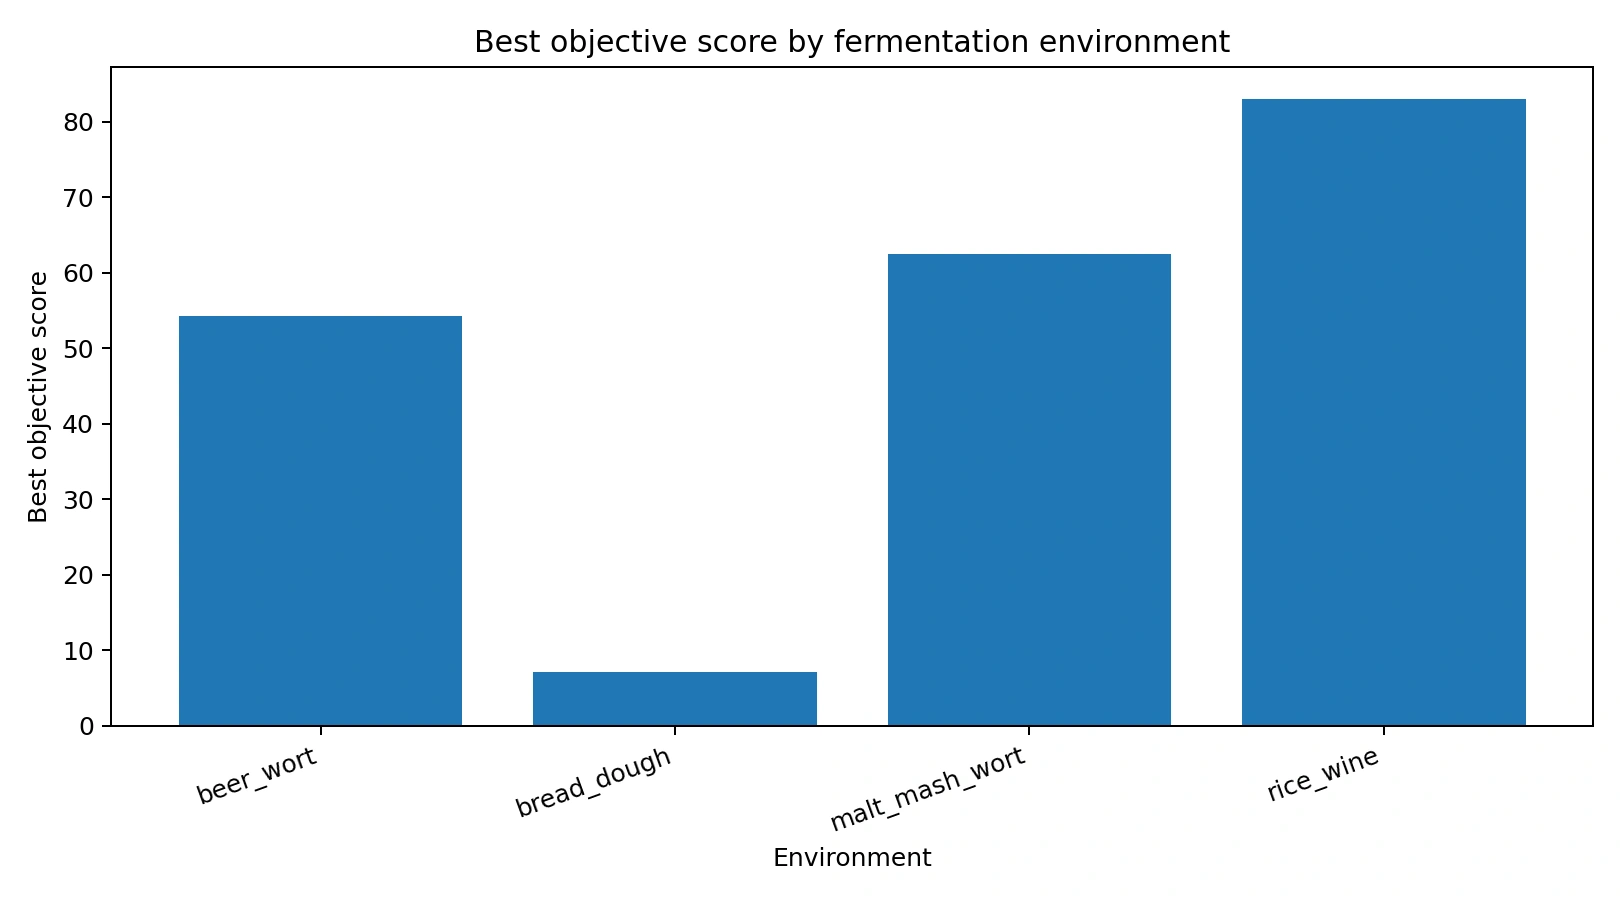
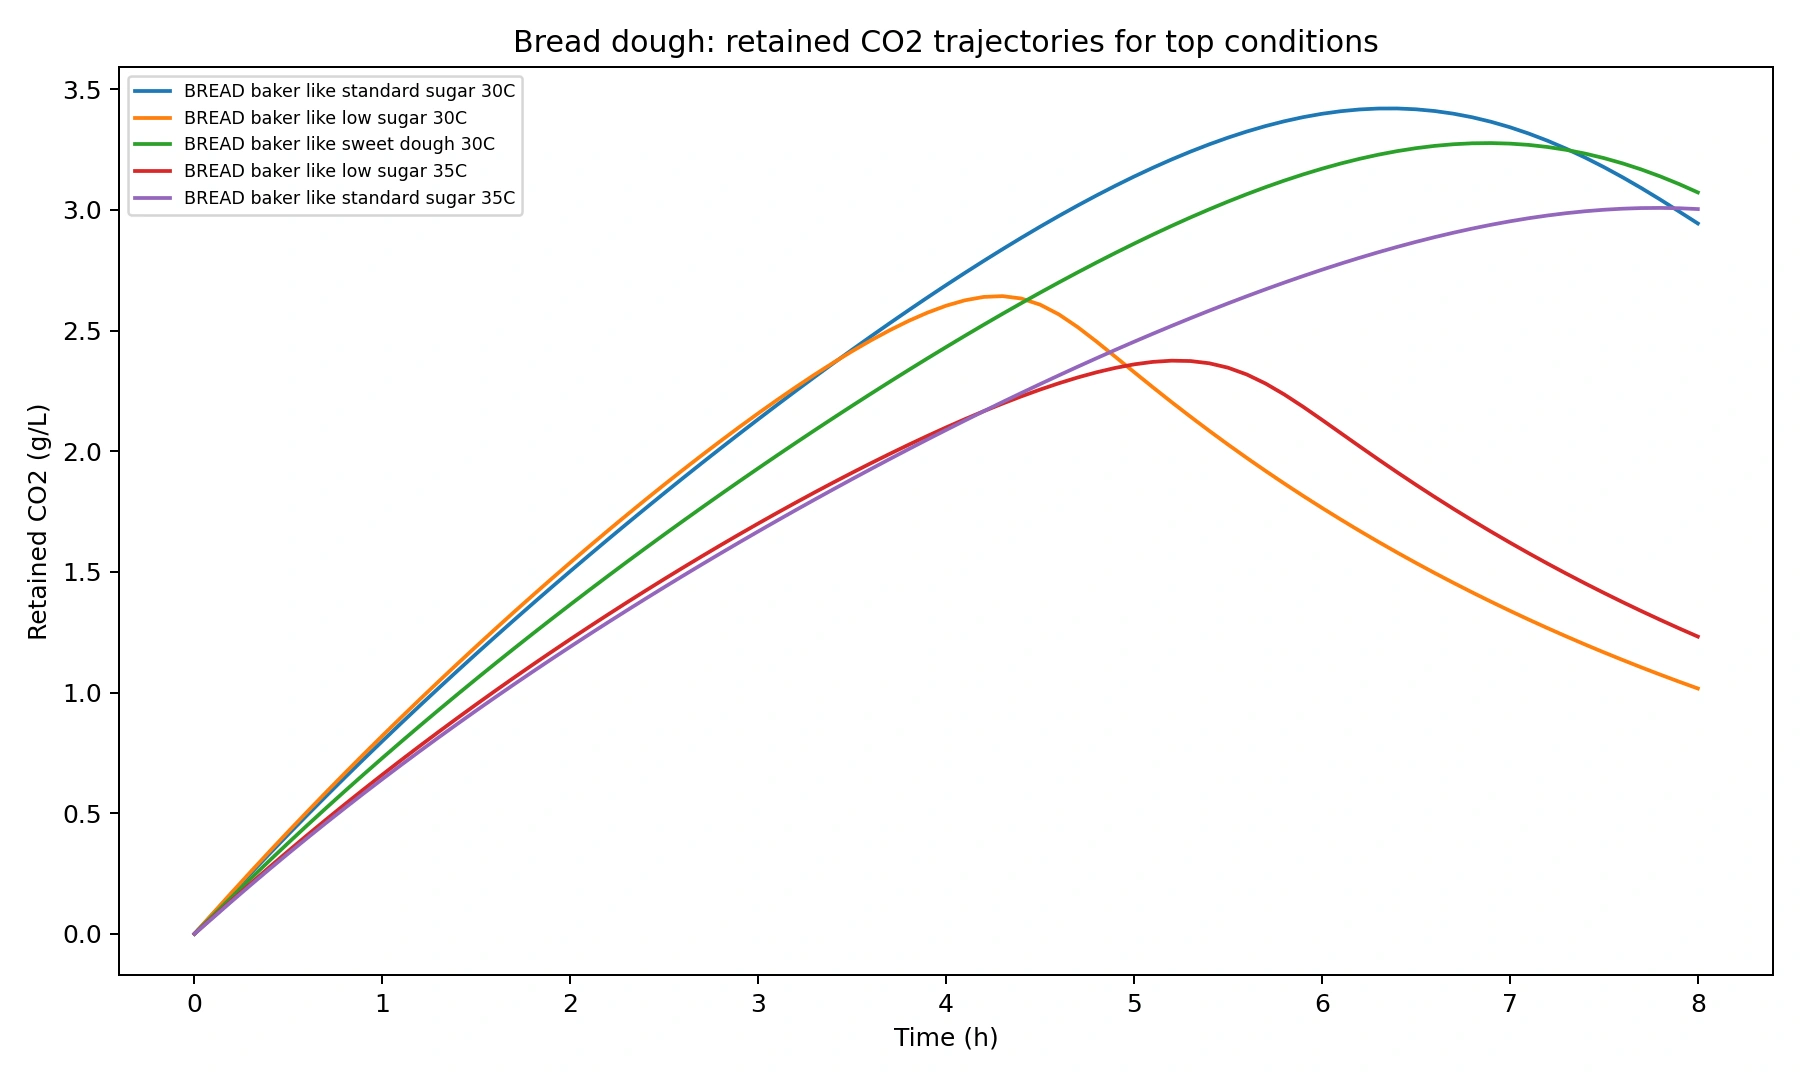
The condition sweep produced environment-specific optima rather than a single universal optimum. The best bread condition was a baker-like standard-sugar condition at 30 C, optimized for retained CO2 over the short proofing window. The best rice-wine condition was a stress-tolerant strong-koji setting at 25 C, producing 87.82 g/L ethanol, or approximately 11.13% v/v. The best beer-wort condition was an ale-like standard-wort setting at 22 C with low continuing oxygen transfer, producing 49.18 g/L ethanol, or approximately 6.23% v/v. The best malt mash/wort condition used a 62 C mash and produced 38.05 g/L ethanol, or approximately 4.82% v/v, while still exposing nitrogen limitation as the next bottleneck.
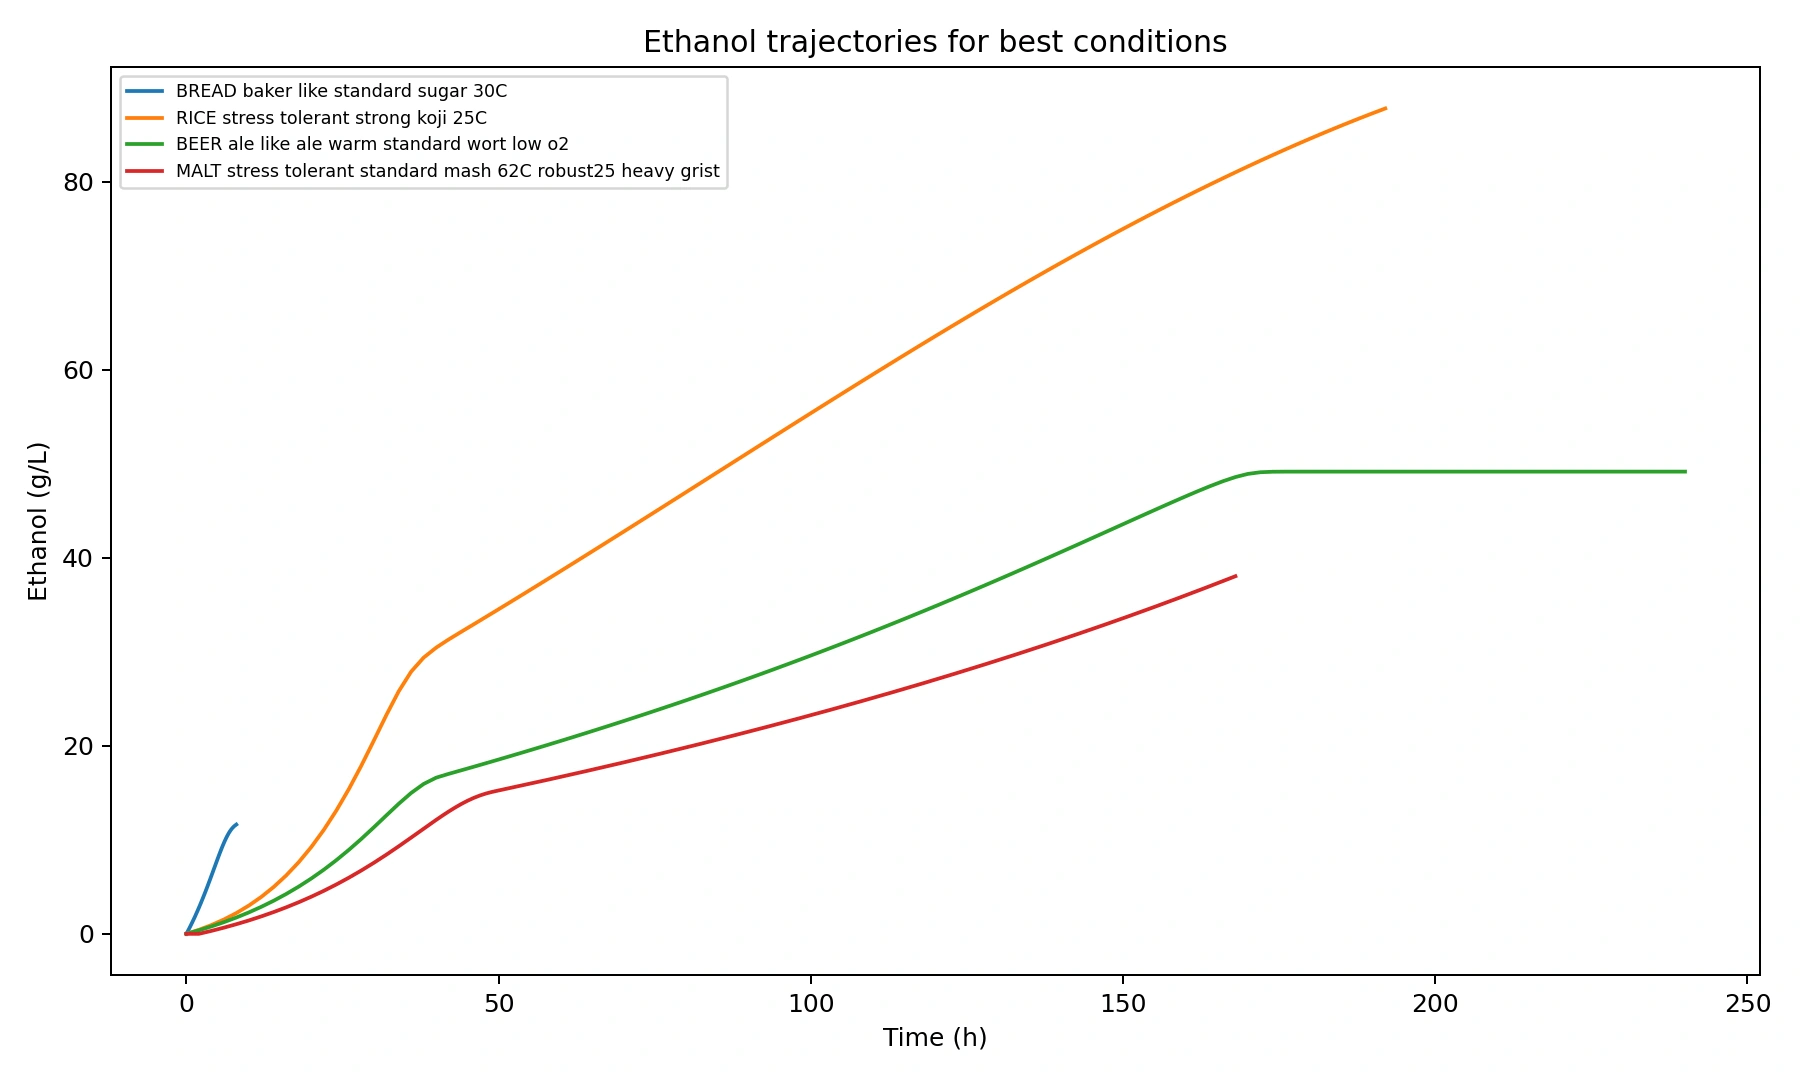
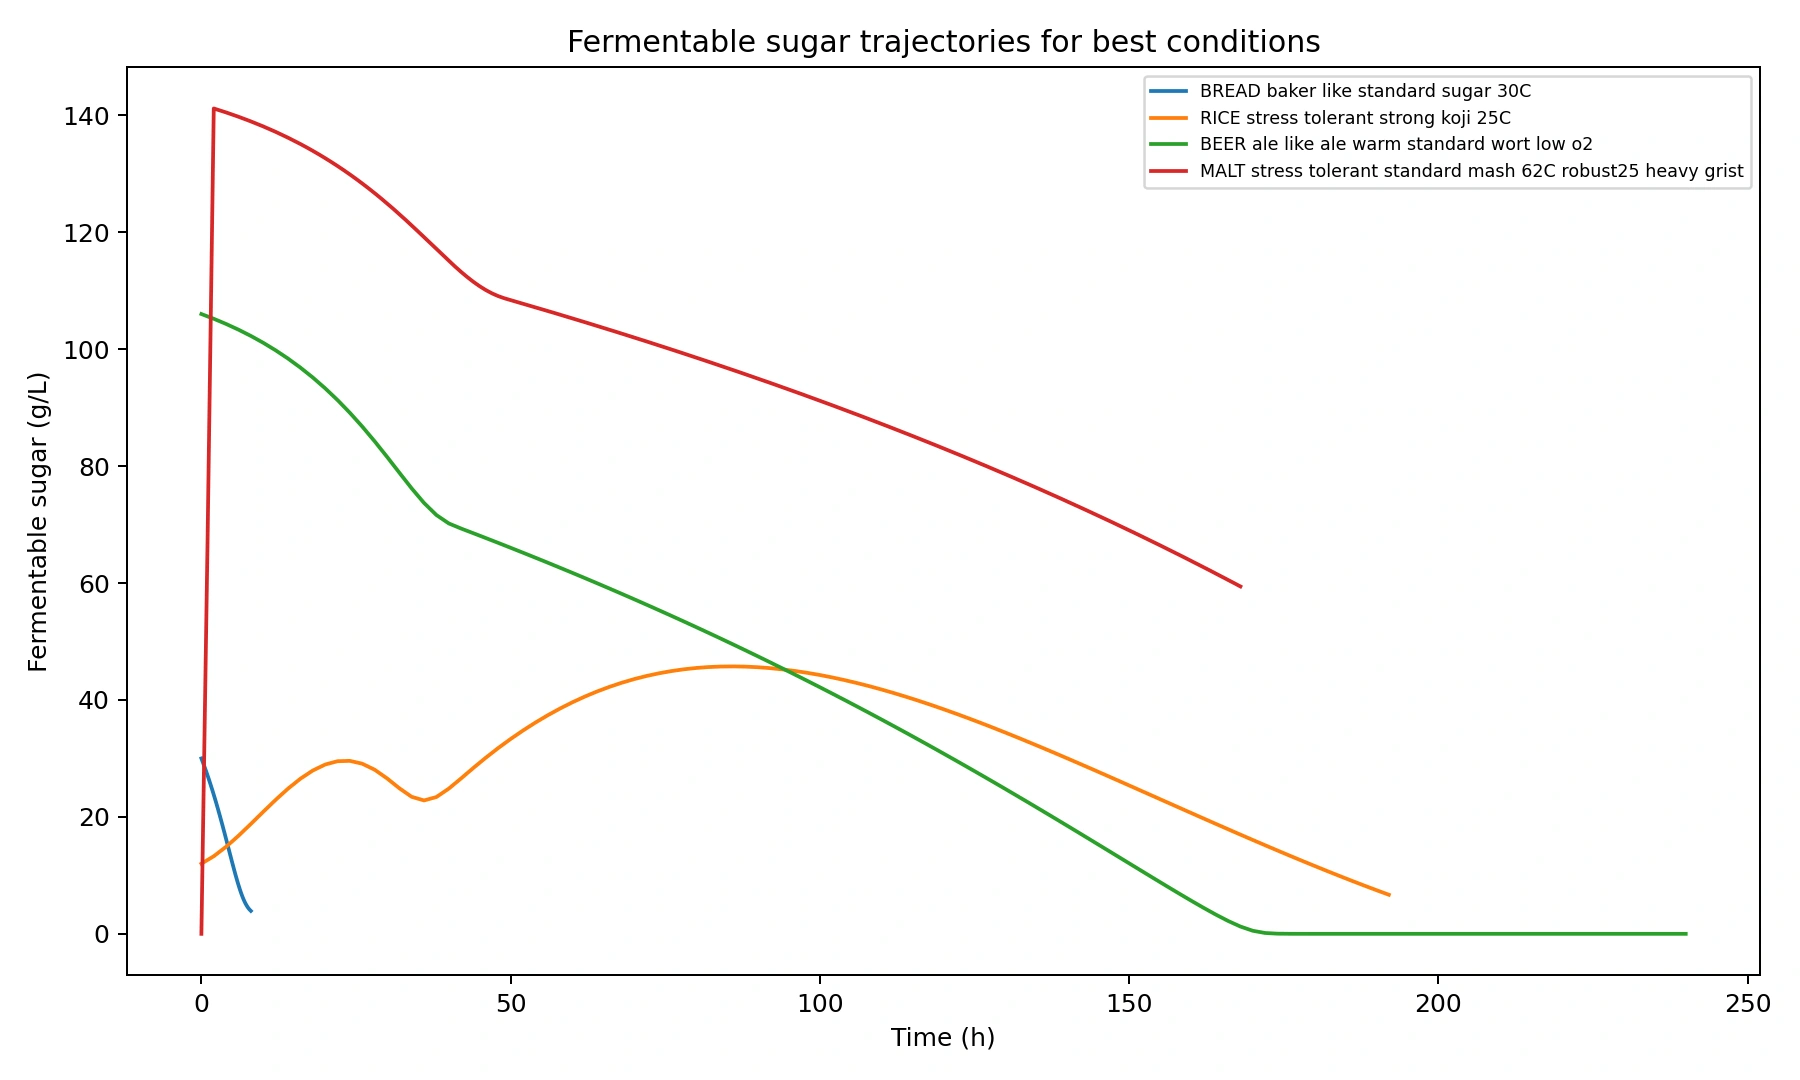
The result trajectories show that the environments differ in dominant process behavior. Beer wort consumes fermentable sugars rapidly and gives a clean attenuation-like trajectory. Rice wine and malt mash/wort show carbohydrate-release dynamics because fermentable sugars appear through saccharification before or during fermentation. Bread dough is best interpreted through CO2 production and retention rather than final ethanol. These differences support the decision to define environment-specific objective functions rather than a single generic score.
The failure-mode distribution further supports the interpretability of the model. Malt mash/wort conditions frequently become starch-conversion limited when the mash temperature is away from the effective saccharification region, whereas high-gravity conditions can become nitrogen-limited after sufficient carbohydrate is released. This staged bottleneck behavior is difficult to see from final ethanol alone but becomes visible when the full ODE-network state is exported.
The simulator should be described as literature-aligned and semi-quantitative rather than as a fully validated industrial predictor. Nevertheless, several simulated optima overlap with reported fermentation ranges. The rice-wine preset predicted approximately 11.13% v/v ethanol near 25 C after an eight-day fermentation window, aligning with makgeolli-like reports around 25 C and near 11% alcohol [7], [12].
The malt mash/wort preset selected the 62 C region as the best saccharification-centered setting. This is consistent with the conventional brewing interpretation of the maltose-rest region and with reported beer alcohol values near ordinary 4.8-4.9% v/v ranges under conventional mashing protocols [8], [13]. The model therefore captures an important qualitative and semi-quantitative feature: when saccharification is adequate, the next bottleneck can shift from starch conversion to nitrogen or yeast physiology.
The ale-like beer result is plausible in ethanol terms, with 6.23% v/v in the representative standard-wort condition and rapid fermentable-sugar depletion. However, the beer final pH remains too high relative to typical finished beer expectations, so the beer acidification term should be calibrated before claiming process-level accuracy. Bread dough shows a directionally appropriate 30 C CO2-oriented optimum, but direct comparison with bread-yeast experiments requires conversion from g/L CO2 proxy to mL CO2 per 2 h per 10 g flour [10].
Discussion
The main result is that a single ODE-network chemical complex system can generate plausible and interpretable trajectories across four fermentation environments. This supports the usefulness of an explicit state-space representation: the model does not merely estimate a final score but exposes intermediate variables, competing bottlenecks, and failure labels.
The model also clarifies what should not yet be claimed. It is not a high-fidelity prediction engine for flavor, volatile aroma compounds, detailed microbial ecology, dough rheology, or calibrated industrial process control. The correct claim is narrower and stronger: the simulator is a compact, inspectable, literature-aligned benchmark that can be extended with environment-specific calibration layers.
The implicit-network implementation should also be documented clearly. The graph is reconstructed from code-level flux terms; it is not a runtime graph object. This is acceptable for a lightweight simulator, but a future version could store the node and edge list as a first-class data structure so that equations, visualizations, and supplementary edge lists are generated from a single source of truth.
Limitation and Future Work
Three improvements are most important. First, beer acidification should be calibrated against pH trajectories, not only final ethanol. Second, the bread model should add a physical gas-retention and unit-conversion layer so that CO2 can be compared directly with mL/2 h/10 g flour assays. Third, the malt mash/wort module should support richer step-mash schedules, such as proteolysis rest, maltose rest, and saccharification rest, rather than relying on a small set of simplified mash-temperature presets.
The simulator is also well suited for agentic control studies. Candidate actions include temperature scheduling, aeration, pH correction, nitrogen supplementation, sugar or starch feeding, and mash-rest scheduling. Candidate rewards can be defined per environment: retained CO2 for bread, ethanol and residual carbohydrate for rice wine, attenuation and byproduct penalties for beer, and saccharification efficiency plus fermentation completion for malt wort.
Conclusion
Table 2. Supplementary result files referenced by the manuscript.
| ID | File | Purpose |
|---|---|---|
| S1 | experiment_conditions.csv | All 108 condition definitions and parameter settings. |
| S2 | timeseries.csv | Recorded state trajectories for all conditions and time points. |
| S3 | summary.csv | Condition-level final values, metrics, rankings, and failure labels. |
| S4 | environment_rankings.csv | Environment-specific rankings used for objective comparisons. |
| S5 | column_dictionary.csv | Definitions for output files and columns. |
| S6 | manifest.csv | Run metadata, file counts, and script information. |
| S7 | corrected_summary.csv | Total-carbohydrate conversion metrics for rice-wine and malt-wort cases. |
| S8 | top5_by_environment.csv | Top-ranked conditions within each environment. |
| S9 | failure_mode_counts.csv | Aggregated failure-mode counts. |
| S10 | group_trends.csv | Grouped trend summaries for figure preparation. |
| S11 | ode_network_core_edges.csv / ode_network_full_edges.csv | Reconstructed edge lists used to visualize the implicit ODE network. |
This paper presented an ODE-network-based chemical complex system simulator for multi-environment fermentation. The simulator represents fermentation as a network of interacting substrates, enzymes, yeast physiology, environmental resources, and metabolic products. Across 108 simulated conditions, it identified plausible optima and interpretable failure modes for bread dough, rice wine, beer wort, and malt mash/wort. Literature-aligned comparisons support the model as a semi-quantitative simulator and as a foundation for future calibration, visualization, and agentic control benchmarks.
Code and Data Availability
The simulator code is available in the public GitHub repository needleworm/fermentation_simul [15]. The repository is intended to contain the one-command Python implementation for generating condition definitions, time-series outputs, summaries, rankings, network visualizations, and metadata CSV files. Other Supplementary data is also available at the GitHub repository.
References
[1] S. M. Choo, B. Ban, J. I. Joo, and K. H. Cho, "The phenotype control kernel of a biomolecular regulatory network," BMC Systems Biology, vol. 12, article 49, 2018. doi: 10.1186/s12918-018-0576-8.
[2] B. Ban, M. Lee, and D. Ryu, "ODE Network Model for Nonlinear and Complex Agricultural Nutrient Solution System," in Proc. ICTC, 2019, pp. 996-1001. doi: 10.1109/ICTC46691.2019.8939946.
[3] B. Ban, "Mathematical Model and Simulation for Nutrient-Plant Interaction Analysis," in Proc. ICTC, 2020, pp. 1531-1536. doi: 10.1109/ICTC49870.2020.9289083.
[4] B. Ban, J. Lee, D. Ryu, M. Lee, and T. D. Eom, "Nutrient Solution Management System for Smart Farms and Plant Factory," in Proc. ICTC, 2020, pp. 1537-1542. doi: 10.1109/ICTC49870.2020.9289192.
[5] B. Ban, D. Ryu, and M. Lee, "Machine Learning Approach to Remove Ion Interference Effect in Agricultural Nutrient Solutions," in Proc. ICTC, 2019, pp. 1156-1161. doi: 10.1109/ICTC46691.2019.8939812.
[6] B. Ban, "Deep learning method to remove chemical, kinetic and electric artifacts on ISEs," in Proc. ICTC, 2020, pp. 1242-1246. doi: 10.1109/ICTC49870.2020.9289389.
[7] D. R. Kim, B. M. Seo, M. H. Noh, and Y. W. Kim, "Comparison of temperature effects on brewing of Makgeolli using uncooked germinated black rice," Korean Society for Biotechnology and Bioengineering Journal, vol. 27, no. 4, pp. 251-256, 2012. doi: 10.7841/ksbbj.2012.27.4.251.
[8] F. Endres, F. Prowald, J. Wackerbauer, and M. Geiger, "Constant temperature mashing at 72 C for the production of beers with a reduced alcohol content in micro brewing systems," European Food Research and Technology, vol. 248, pp. 1457-1468, 2022. doi: 10.1007/s00217-022-03968-2.
[9] S. Q. Liu and A. Y. H. Quek, "Evaluation of beer fermentation with a novel yeast Williopsis saturnus var. mrakii NCYC 500," Food Technology and Biotechnology, vol. 54, no. 4, pp. 403-412, 2016.
[10] D. Mikumo et al., "Improved leavening ability of a wild yeast Saccharomyces cerevisiae AK46 2-deoxyglucose resistant mutant," Food Science and Technology Research, vol. 21, no. 4, pp. 623-630, 2015.
[11] J. De Roos, P. Vandamme, and L. De Vuyst, "Wort substrate consumption and metabolite production during lambic beer fermentation and maturation explain the successive growth of specific bacterial and yeast species," Frontiers in Microbiology, vol. 9, article 2763, 2018. doi: 10.3389/fmicb.2018.02763.
[12] B. Wong et al., "Characterisation of Korean rice wine (makgeolli) prepared by different processing methods," Current Research in Food Science, vol. 6, article 100420, 2023. doi: 10.1016/j.crfs.2022.100420.
[13] D. E. Briggs, C. A. Boulton, P. A. Brookes, and R. Stevens, Brewing: Science and Practice. Cambridge, UK: Woodhead Publishing, 2004.
[14] E. J. Pires, J. A. Teixeira, T. Branyik, and A. A. Vicente, "Yeast: the soul of beer aroma - a review of flavour-active esters and higher alcohols produced by brewing yeast," Applied Microbiology and Biotechnology, vol. 98, pp. 1937-1949, 2014. doi: 10.1007/s00253-013-5470-0.
[15] B. Ban, "fermentation_simul: ODE-network benchmark for multi-environment fermentation," GitHub repository, 2026. Available: https://github.com/needleworm/fermentation_simul.
Citation
형식을 누르면 인용 정보가 복사됩니다.